SIAT Synthesized Video Quality Database
Xiangkai Liu, Yun Zhang, Sudeng Hu, Sam Kwong, C.-C. Jay Kuo and Qiang Peng
Introduction
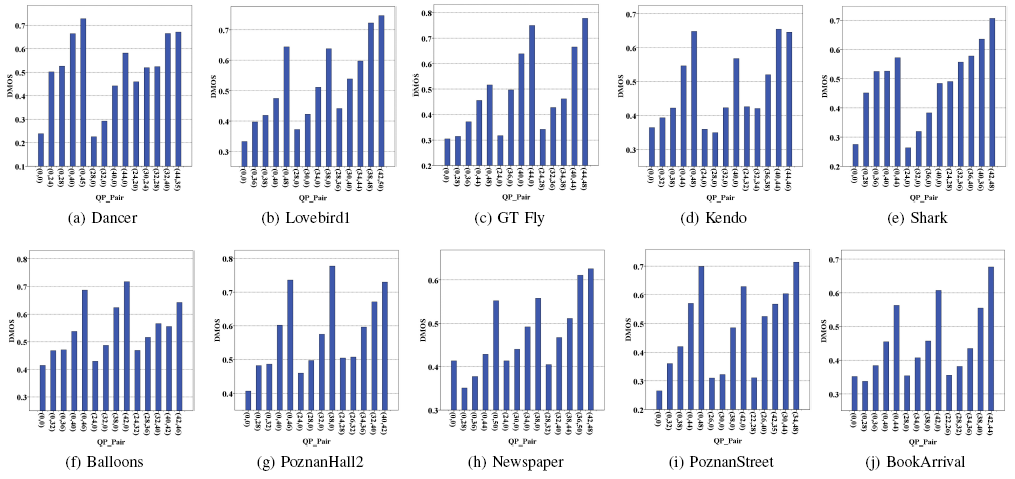
We develop a synthesized video quality database which includes ten different MVD sequences and 140 synthesized videos in 1024×768 and 1920×1088 resolution. For each sequence, 14 different texture/depth quantization combinations were used to generate the texture/depth view pairs with compression distortion. A total of 56 subjects participated in the experiment. Each synthesized sequence was rated by 40 subjects using single stimulus paradigm with continuous score. The Difference Mean Opinion Scores (DMOS) are provided.
Keywords: Video quality assessment, synthesized video quality database, temporal flicker distortion, multi-view video plus depth, view synthesis, 3D Video.
1. X. Liu, Y. Zhang, S. Hu, S. Kwong, C.-C. J. Kuo, and Q. Peng, "Subjective and Objective Video Quality Assessment of 3-D Synthesized View with Texture/Depth Compression Distortion", IEEE Transactions on Image Processing, vol.24, no.12, pp.4847-4861, Dec. 2015. (pdf, bib)
Ten MVD Sequences Used in SIAT Database

Fig.1. Ten MVD sequences used in SIAT database.
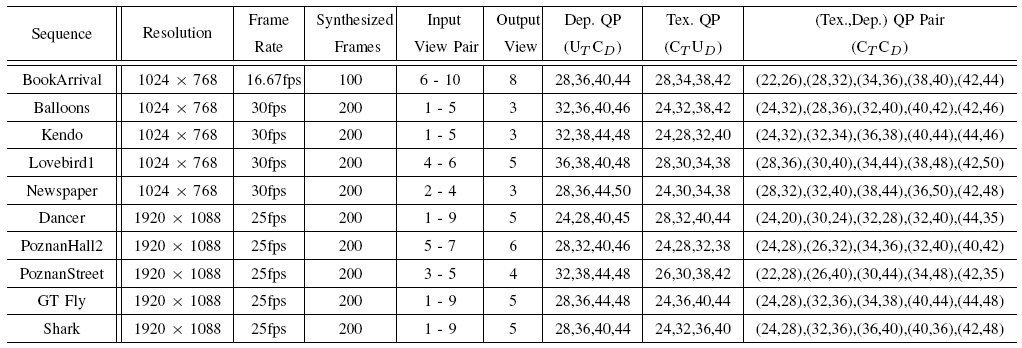
Ten MVD sequences, as shown in Fig. 1, provided by MPEG for the 3D video coding contest are used in our experiment. The information about the test sequences is given in Fig.2. The Dancer, GT Fly and Shark sequences are computer animation videos, and the others are natural scenes. There exist camera movement in sequences Balloons, Kendo, Dancer, GT Fly, Shark and PoznanHall2, while the cameras in BookArrival, Lovebird1, Newspaper, PoznanStreet are still.
Sequence Information and Texture/Depth Compression QP Pairs

Fig.2. Sequence Information and Texture/Depth Compression QP Pairs.
The input texture/depth view pairs were encoded with 3DV-ATM v10.0, which is the 3D-AVC based reference software for MVD coding. The view synthesis algorithm used is the VSRS-1D-Fast software implemented in the 3D-HEVC reference software HTM.
DMOS

Fig.3. DMOS of the synthesized sequences with different texture/depth compression QP pairs in the SIAT Synthesized Video Quality Database. The pair of values on the horizontal axis represent the (texture, depth) QP. The values on the vertical axis represent the DMOS value.
The experiment is conducted in two sessions. 84 videos were evaluated in the first session and 56 videos were evaluated in the second session. There were a total of 56 non-expert subjects (38 males and 18 females with an average age of 24) participated in the experiment and each test video was evaluated by 40 subjects. The quality scores assigned by each subject should be normalized per person before computing DMOS. Because there were 24 subjects participated in both the first and the second sessions, to avoid inconsistent scoring criteria of the same subject between two sessions, all the reference videos were included in both sessions using hidden reference removal procedure. The DMOS score for each test video was computed per session using the quality score assigned to the corresponding reference video in that session. All subjects taking part in the experiment are graduate students. Every subject had been told the procedure of the test and had watched a training sequence before starting the experiment.