SIAT Depth Quality Database
Xiangkai Liu, Yun Zhang, Qiang PengIntroduction
We develop a stereoscopic video depth quality database which includes ten different stereoscopic sequences and 160 distorted stereo videos in 1920×1080 resolution. The ten sequences are from the Nantes-Madrid-3D-Stereoscopic-V1 (NAMA3DS1) database. There are four categories of impairments in the NAMA3DS1 database which are H.264 coding, JPEG2000 coding, down-sampling and sharpening. However, only symmetric distortions are considered in NAMA3DS1 database. Since both symmetric and asymmetric distortions are necessary to study, we generate additional stereoscopic videos with asymmetric distortions. There are 90 symmetrically distorted video pairs and 70 asymmetrically distorted video pairs. 30 subjects (24 male, 6 female) participated in the symmetric distortion experiment and 24 subjects (19 male, 5 female) participated in the asymmetric distortion experiment.
Keywords: Depth perception, depth quality degradation, 3D stereoscopic video, video quality assessment, QoE.
Publications
Quality Assessment for Symmetrically and Asymmetrically Distorted Stereoscopic 3D Videos," Signal Processing: Image Communication (SP-IC), Vol. 78, pp. 293-305, Oct. 2019. (SCI IF 2.814) (pdf)
Stereoscopic Sequences Used in the Subjective Experiment

Fig.1. Ten stereoscopic sequences from the NAMA3DS1 database which are used in the subjective experiment.
Ten sequences from the Nantes-Madrid-3D-Stereoscopic-V1 (NAMA3DS1) database are used in our subjective experiments (as shown in Fig.1). All the sequences have a Full HD resolution of 1920×1080 and the frame rate is 25. The length of sequence Umbrella is 13 seconds and that of the other sequences is 16 seconds.
Impairments Setting of the Test Sequences
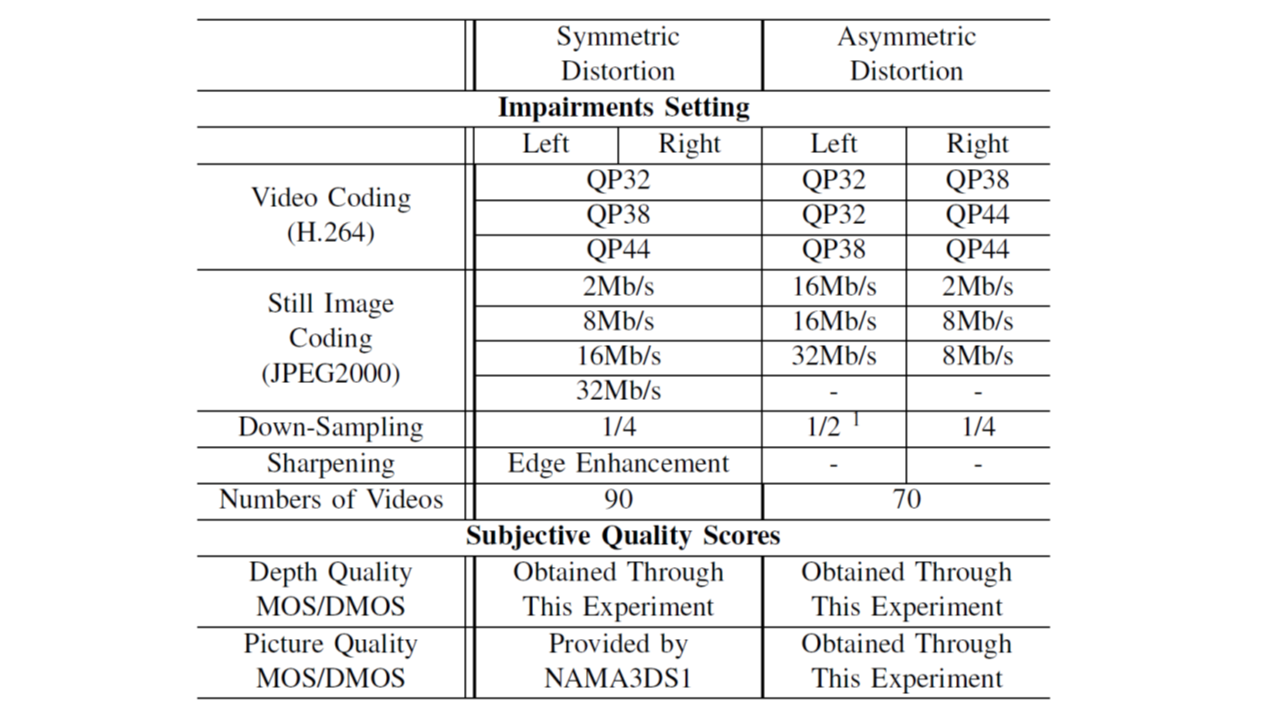
Fig.2. Impairments Setting of the Test Sequences.
There are four categories of impairments in the NAMA3DS1 database which are H.264 coding, JPEG2000 coding, down-sampling and sharpening. However, only symmetric distortions are considered in NAMA3DS1 database. Since both symmetric and asymmetric distortions are necessary to study, we generate additional stereoscopic videos with asymmetric distortions. The description of the test videos is shown in Fig.2. The 1/2 down-sampling which is not involved in the original NAMA3DS1 database is realized with the bilinear interpolation method. There are 90 symmetrically distorted video pairs and 70 asymmetrically distorted video pairs. Finally, the data sets in our subjective experiment contain 160 distorted stereoscopic video pairs.
Subjective Experiment Procedure
The subjective experiment consists of two parts : symmetric distortion and asymmetric distortion. There are 30 subjects (24 male, 6 female) participated in the symmetric distortion experiment and 24 subjects (19 male, 5 female) participated in the asymmetric distortion experiment. All of the subjects are graduate students and their average age is 25. The visual acuity of the subjects are normal or corrected to normal and they all passed the random dot test. The adopted 3D display is a 27" LG D2792 polarized 3D display with 1920×1080 resolution. The experiment environment follows the recommendation of ITU-R BT.2021. The screen brightness is 250 cd/m2, resulting in 100 cd/m2 after the polarized glasses. The depth quality is evaluated in the symmetric distortion experiment while both depth and picture quality are evaluated in the asymmetric distortion experiment. The single-stimulus (SS) method with discrete five-grade scale is used. The quality labels are "Excellent", "Good", "Fair", "Poor" and "Bad". The reference videos of each sequence are also included in the test for computing the difference mean opinion score (DMOS). Before the experiment, several stereoscopic videos which are not included in the test are used as training set to allow the subjects be familiar with the 3D display. The symmetric and asymmetric distortion experiments took about 55 and 50 minutes for each subject, respectively. Each subject can take a 5 minutes break after every 30 minutes of experiment.
Depth Quality DMOS v.s. Picture Quality MOS for Symmetric Distortion Data Sets
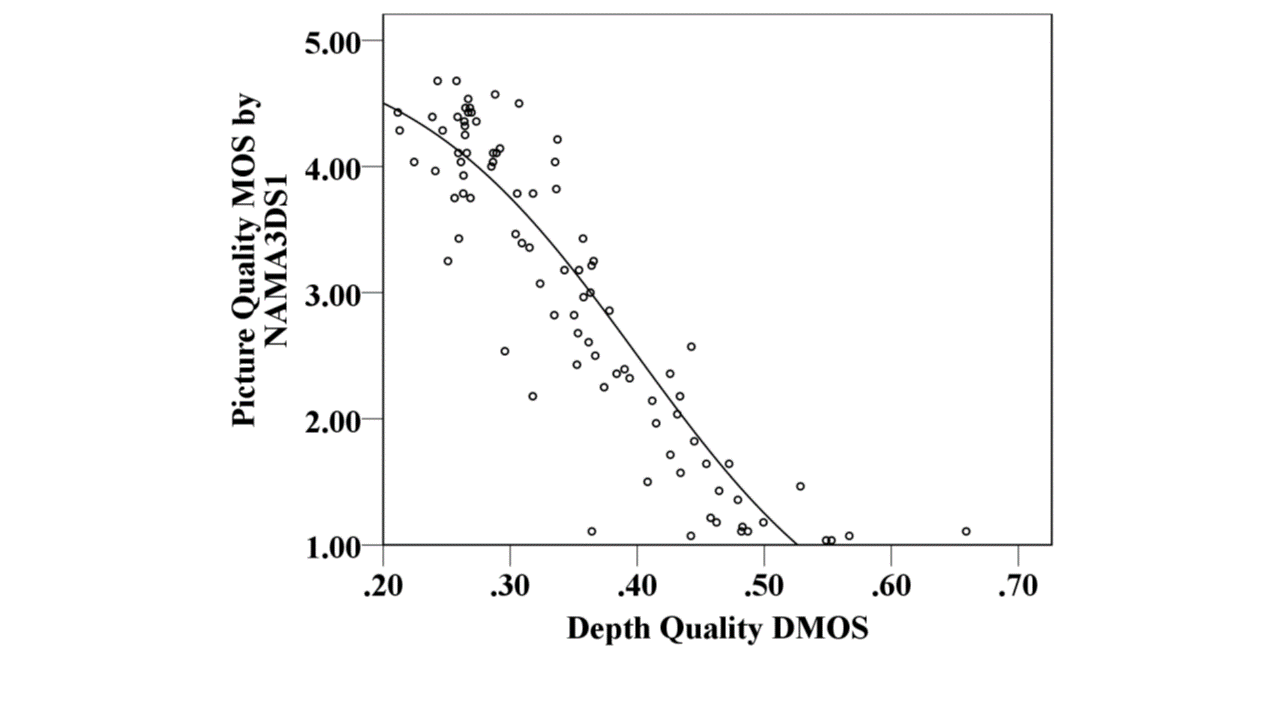
Fig.3. Depth Quality DMOS v.s. Picture Quality MOS for Symmetric Distortion Data Sets.
Depth Quality DMOS v.s. Picture Quality DMOS for Asymmetric Distortion Data Sets
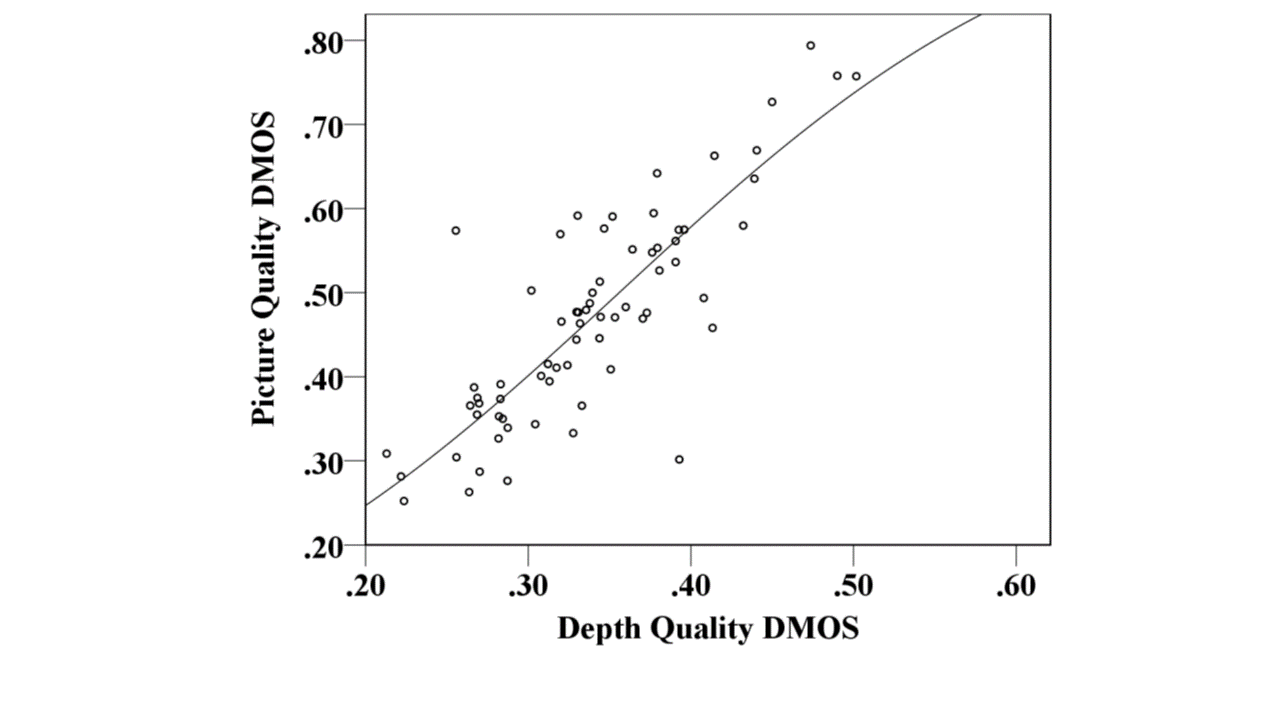
Fig.4. Depth Quality DMOS v.s. Picture Quality DMOS for Asymmetric Distortion Data Sets.
The processing of the scores follows the recommendation of VQEG. The difference score is obtained by subtracting the score of the test videos from the score of the reference. Then the difference scores are normalized to z-scores and linearly scaled to the interval [0,1]. Finally, the mean of the normalized difference scores is calculated as DMOS. The correlations of the depth and picture quality are shown in Fig.3 and Fig.4. Note that, the picture quality MOS of the symmetric distortion data sets is provided by the NAMA3DS1 database. All the other DMOS are obtained in our experiment. As shown in Fig.3 and Fig.4, the picture quality significantly influences the depth quality. The subjects state that the loss of image details will cause depth quality degradation especially when the original sequence has rich texture details (e.g. the TreeBranches sequence). Specifically, H.264 coding, JPEG2K coding and down-sampling can cause depth degradation while sharpening has little effect on the depth sensation. The Pearson's Linear Correlation Coefficient (LCC) and Spearman Rank Order Correlation Coefficient (SROCC) between the picture and depth quality are (0.901, 0.833) for symmetric distortion and (0.831, 0.775) for asymmetric distortion, respectively.
Database Downloads
- The Test Sequences Can be Downloaded from the Website of NAMA3DS1 Database
- To obtain the DMOS score, please contact us via the following email: Yun Zhang - Email:yun.zhang@siat.ac.cn